Hello,

In this post, we'll explore the use of the label feature to display field values on a map.
Typically, when we look at a map, as shown below, the names of regions are displayed as text. Using the label feature, we can also display the data values we want to represent alongside these region names.

Source: Google Maps
Once again, let's download the Vietnam border map from the following link and load the adm1 file into QGIS:
https://data.humdata.org/dataset/cod-ab-vnm
For better explanations, I did right-click on the layer > Properties > Symbology > Categorized,
Select Value: ADM1_EN, and press the 'Classify' button at the bottom to visualize the differentiation of Vietnam's first-level administrative areas.
To ensure the visibility of the labels to be added later, let's reduce the opacity of the entire legend to 50%.
You can select all by pressing Ctrl+A in the legend window, and when you right-click in this state, the 'Change Opacity' feature will appear.
Now, different color differentiations are displayed.
Next, let's add names to all first-level administrative areas. Follow the steps below and click the 'OK' button afterward:
Right-click on the layer > Properties > Labels > Single Labels
- Value: ADM1_EN
- Text > Set Font and Size
- Font: Arial
- Size: 5
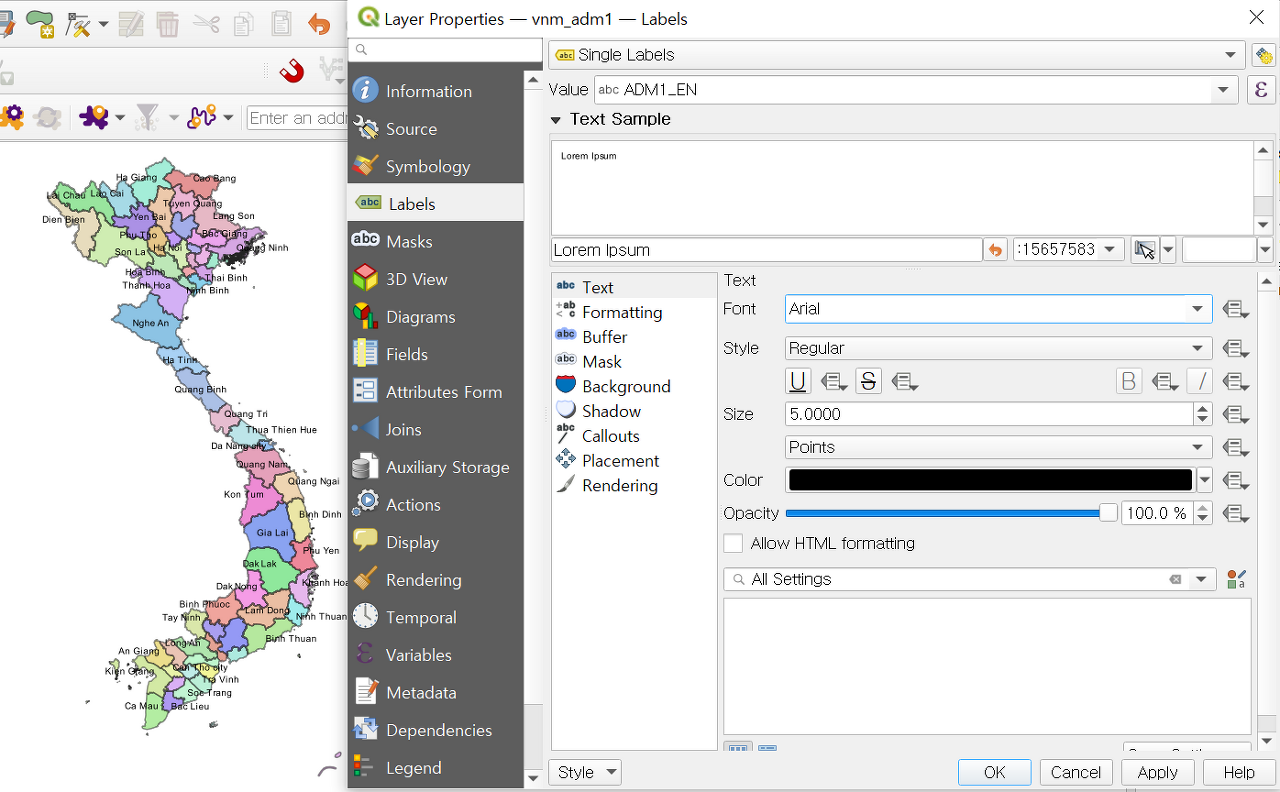
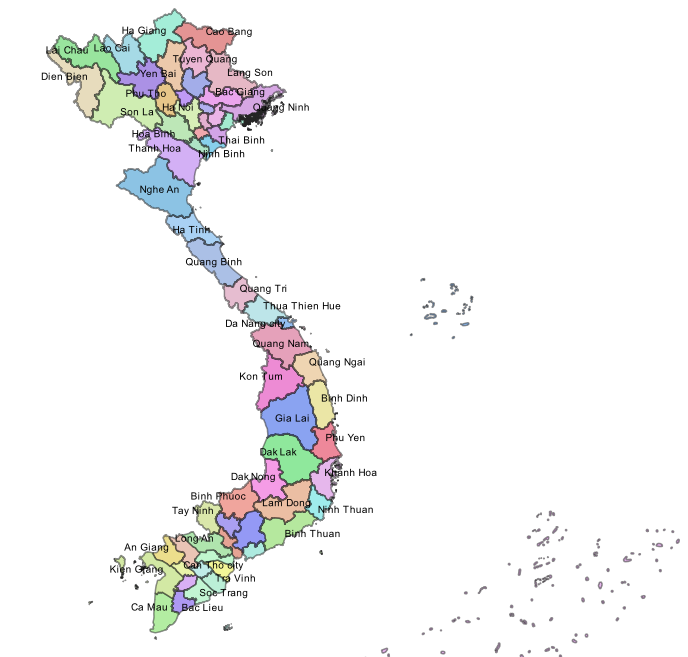
You'll see administrative area labels added to the main screen as shown below.
That concludes our post on adding labels.

Thank you.
'QGIS English Guidance > QGIS Basics' 카테고리의 다른 글
| [QGIS Basics] File Conversion (Raster -> Vector) (0) | 2024.04.08 |
|---|---|
| [QGIS Basics] Refactor Fields - Changing the Field Type (0) | 2024.04.04 |
| [QGIS Basics] Playing around with Legend (0) | 2024.03.30 |
| [QGIS Basics] Playing around with Symbology (0) | 2024.03.27 |
| [QGIS Basics] GIS File Extensions, GIS File Importing (0) | 2024.03.25 |


댓글