
Hello,
In this post, I will discuss how to edit the attribute table of a vector layer to suit your needs.
The editing we'll cover in this content includes adding, deleting, and modifying data.
Unlike raster layers, which do not provide editable attribute tables, only vector layers' attribute tables can be modified.
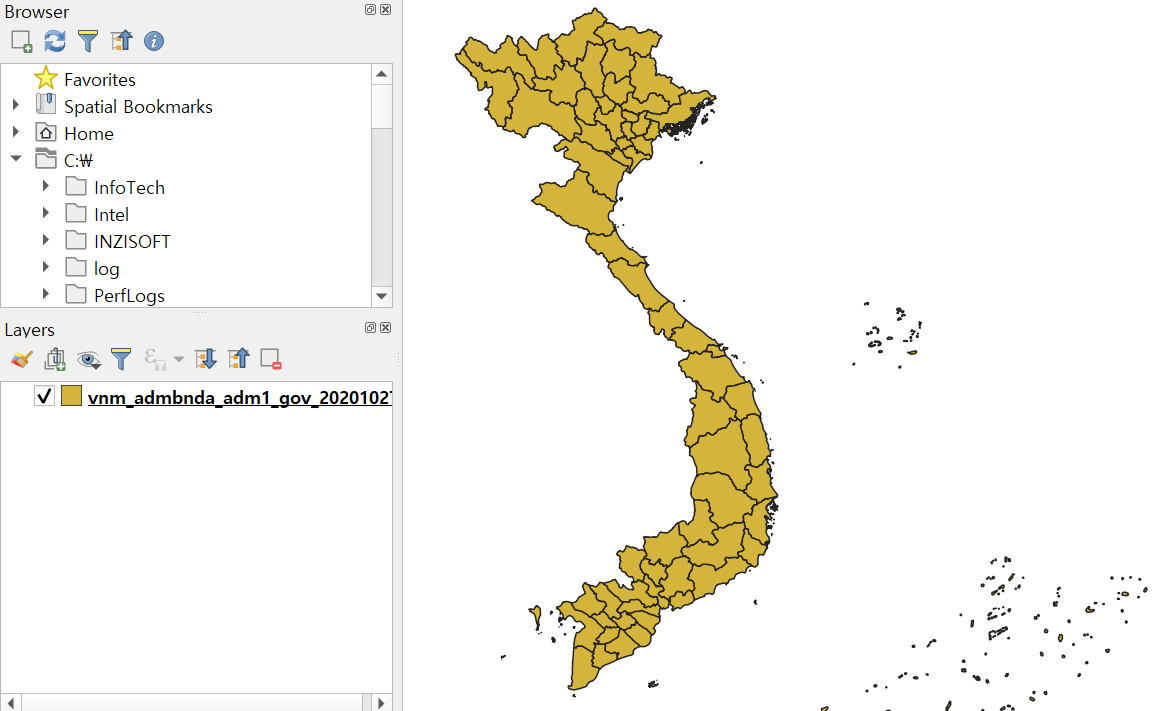
Let's start by downloading the Vietnam border map from the following link for example data:
https://data.humdata.org/dataset/cod-ab-vnm
Viet Nam - Subnational Administrative Boundaries - Humanitarian Data Exchange
[{"value": 71, "date": "2023-10-02"}, {"value": 64, "date": "2023-10-09"}, {"value": 54, "date": "2023-10-16"}, {"value": 47, "date": "2023-10-23"}, {"value": 57, "date": "2023-10-30"}, {"value": 101, "date": "2023-11-06"}, {"value": 52, "date": "2023-11-1
data.humdata.org
Please open the file at the adm1 level for convenience.
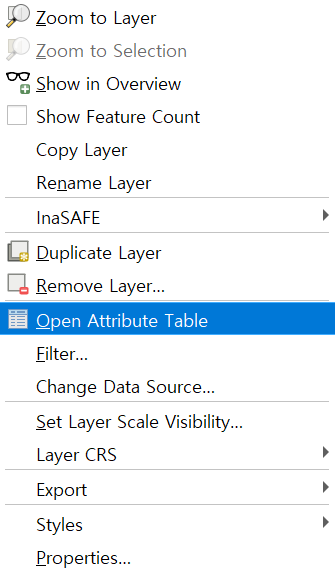
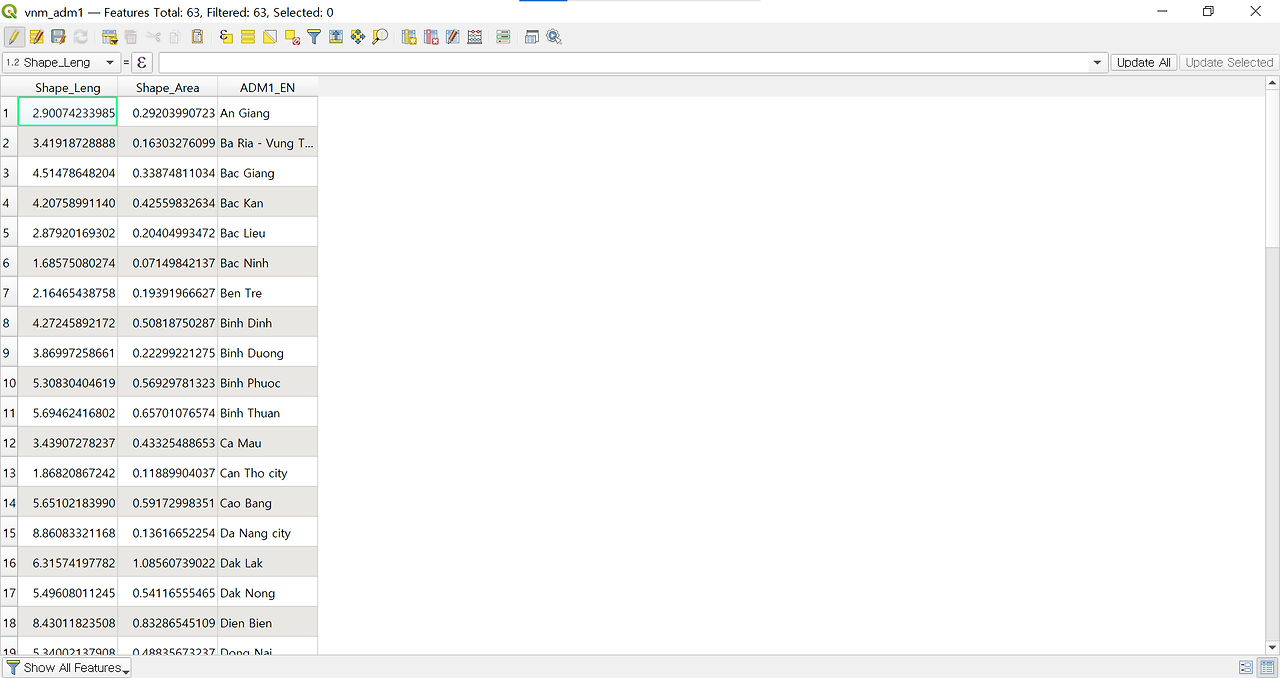
To check the state of the attribute table before any changes, right-click on the layer and open the attribute table.
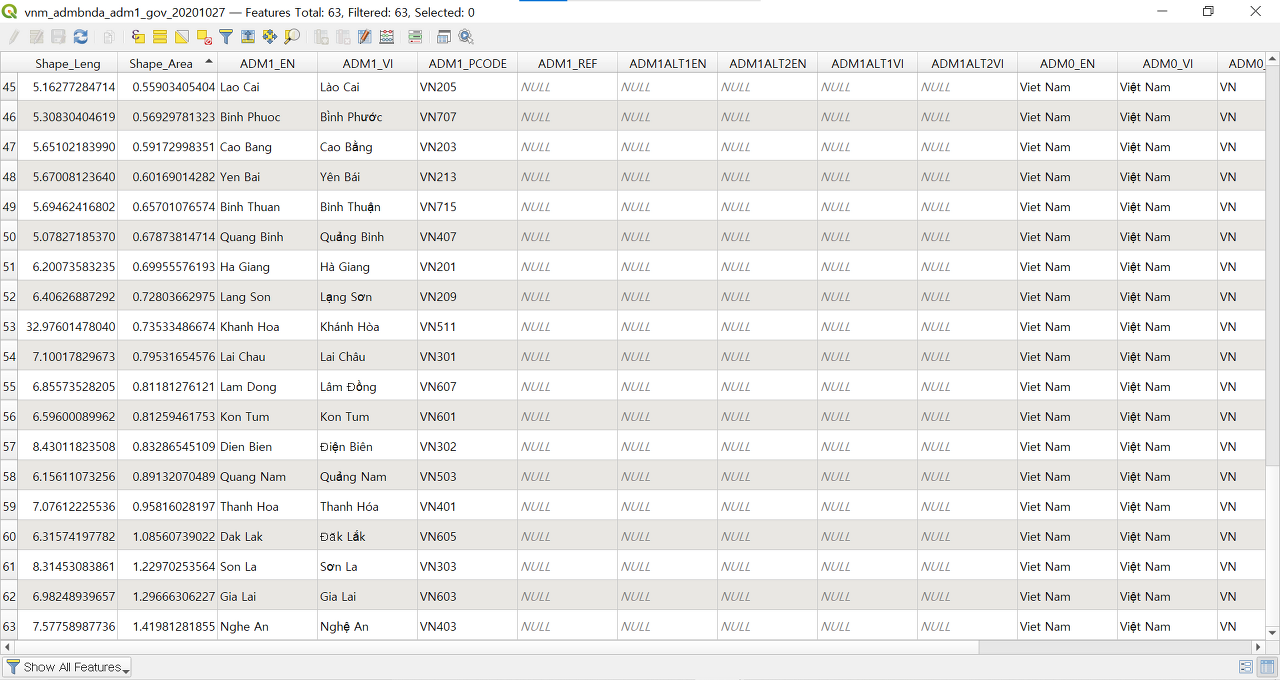
A window with a total of 63 columns comprising the attribute table will appear.
1) Field Deletion
Now, let's remove unnecessary fields and keep only the ones we need. Please note that the first and second fields (Shape_Leng, Shape_Area) are essential spatial information for the dataset and should not be deleted.
We'll keep only the Vietnam administrative level 1 English field (ADM1_EN) and delete all other fields. Although deleting fields is not mandatory in this case, it can make the data easier to manage if there is a lot of unnecessary information. You may need to delete fields again if modifications are required after adding new fields in the following steps.
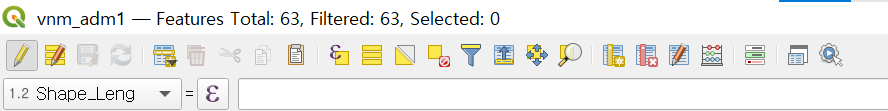
To edit fields, the 'Toggle editing mode' icon, the first pencil-shaped icon among the icons at the top of the attribute table, must be activated.

If the Toggle editing mode is already activated (in color and clickable), click on the icon first. If the Toggle editing mode is not activated, please refer to the activation method in the following post link.
Once the icon is activated, a window will appear where you can enter the following expression, and all other icons on the right that were previously disabled will also be activated.
Now, to proceed with field deletion, click on the 'Delete Field (Ctrl+L)' icon on the right.

A small window containing all field lists will appear.

Select all the fields you want to delete and click 'OK'.
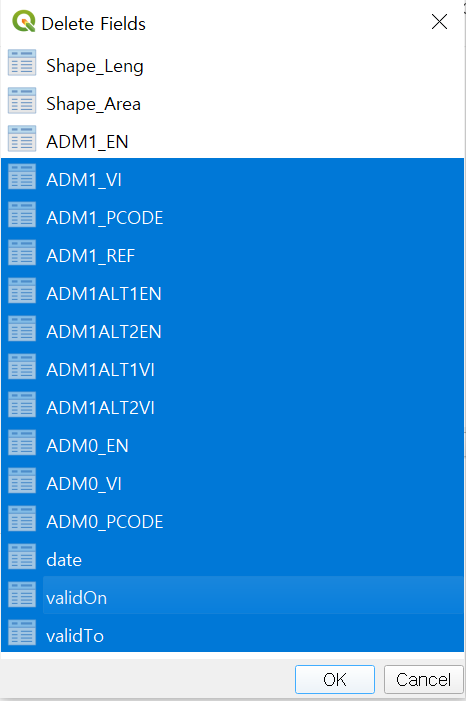
The selected fields will be deleted.
2) Field Addition
Next, let's add a new field.
In the previous post, we practiced combining vector layers with CSV data using the 'Join attributes by field value' feature ( https://qgis-jaehee.tistory.com/7)
If you don't have attribute information connected in this way and want to quickly add fields within GIS, you can use this method.
To add a field, click on the 'New field (Ctrl +W)' icon in the top right corner.

When the window appears, enter arbitrary values as follows and click 'OK':
- Name: festival (the name of the field you want to add)
- Comment: No input required
- Type: Whole number (select field type such as number, text, etc.)
- Length: 10 (It will be added according to the number of rows of the existing field)

A new field has been added.

3) Field Modification
Now, let's change the values of the newly added column and enter arbitrary information about the number of annual festivals held in Vietnam administrative level 1 areas.
※ Please note that the following values are arbitrary and not related to actual data.
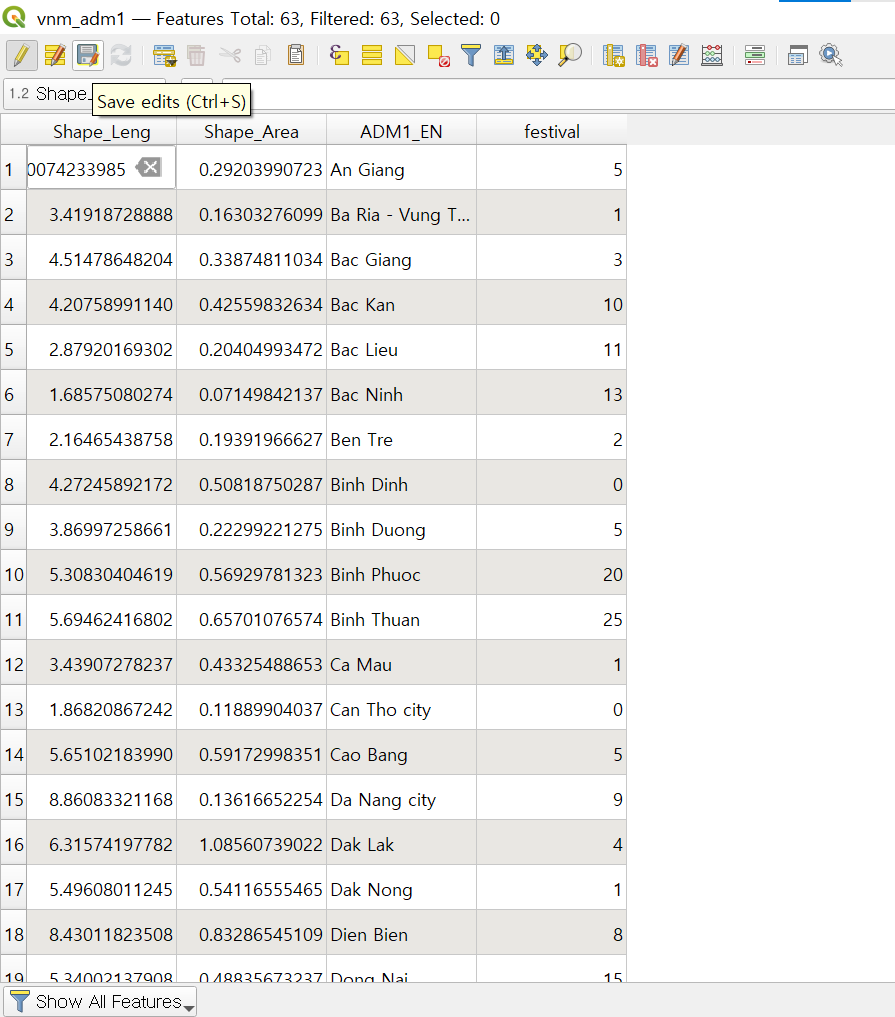
Double-click on each field to enter a number.
As you can see, manual input is required one by one, and unlike Excel, easy copying and pasting between fields are not available. Therefore, if there are many rows for the added field, it may not be convenient.
In this case, it would be better to create a new CSV file and then combine it.
If you want to enter numbers with decimal places, select "Decimal number (double)" in the Type tab when adding fields. It will display up to two decimal places.

Once you have completed the input, click on the save icon (Save edits) in the top left corner.
Now, close the attribute table window and return to the main GIS screen.
Let's use the Symbology feature to check the saved attribute values.
Right-click on the layer > Properties > Go to the Symbology tab and follow these settings:
- Symbol type: Graduated
- Value: festival
The following is optional, and you can apply the legend you want.
I clicked on 'Classify' at the bottom to automatically classify and chose Mode: Equal Count (Quantile).

After clicking 'OK' and returning to the main screen, you can see that the legend and style have been applied.

That concludes our post on editing the attribute table of a vector layer.

Thank you.
'QGIS English Guidance > QGIS Intermediate' 카테고리의 다른 글
| [QGIS Intermediate] Combining Spatial Data and Attribute Table (1) | 2024.04.02 |
|---|

댓글