Hello,
In this post, we'll explore how to combine spatial data and attribute table using QGIS.

Here, spatial data refers to map data with X, Y coordinates or already polygonized map data in formats like shapefile, while attribute data refers to text-based data like Excel data that hasn't been spatialized yet.
If you have Excel values with all geospatial information and corresponding spatial data already generated, combining these two datasets can increase the production of visual and analytical data.
So, GIS users actively utilize the combination of spatial data and attribute data. Now, let's delve into how to do that.
To combine different information, we first need an intersection between the two datasets. In this case, we need a list of identical administrative areas within the same region.
For example, the topic we'll use in this post is '1970 - 2022 Flood Damage Estimates (USD) by Administrative Region in North Korea.'
First, let's get the map containing North Korea's administrative regions from the link below: https://data.humdata.org/dataset/cod-ab-prk
Democratic People's Republic of Korea - Subnational Administrative Boundaries - Humanitarian Data Exchange
[{"value": 5, "date": "2023-09-25"}, {"value": 3, "date": "2023-10-02"}, {"value": 8, "date": "2023-10-09"}, {"value": 4, "date": "2023-10-16"}, {"value": 9, "date": "2023-10-23"}, {"value": 7, "date": "2023-10-30"}, {"value": 1, "date": "2023-11-06"}, {"v
data.humdata.org

After downloading the zip file, open the 'adm_2' file in QGIS, and it will be uploaded to the screen.

Right-click on the file in the layer pane > Open Attribute Table, and you'll see a list of 179 administrative regions.
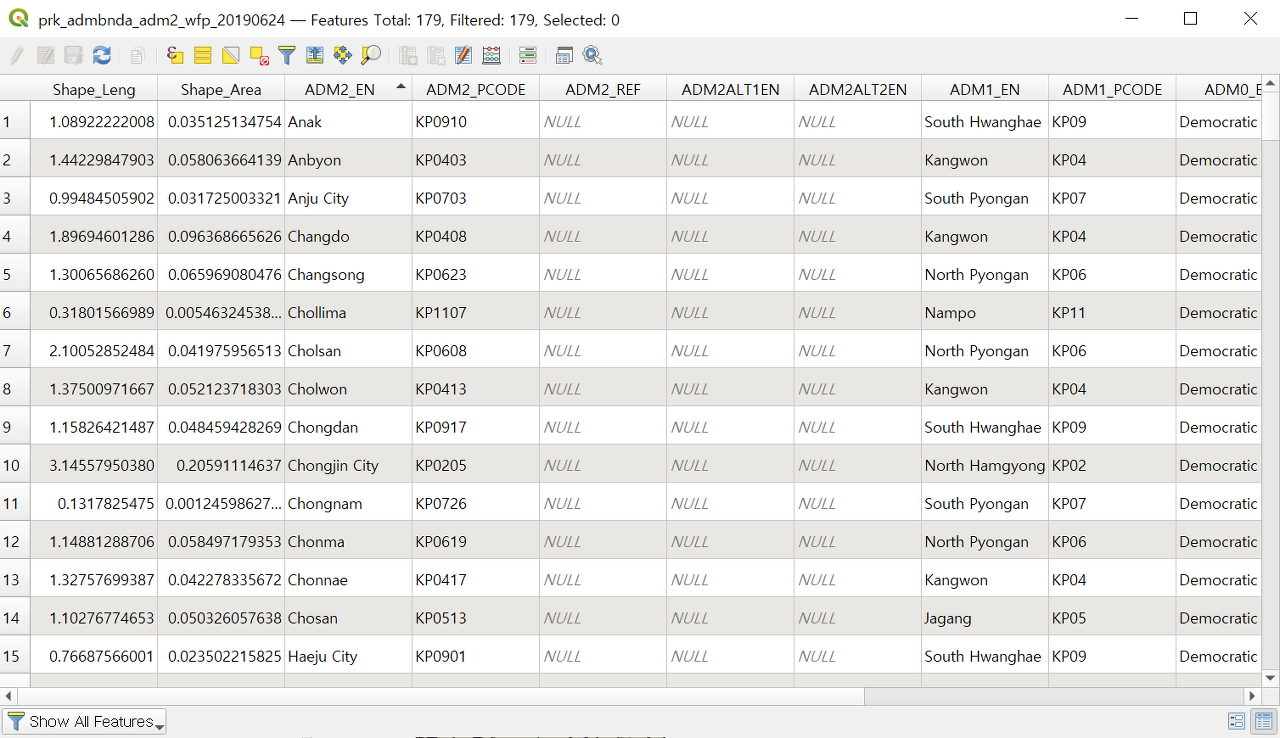
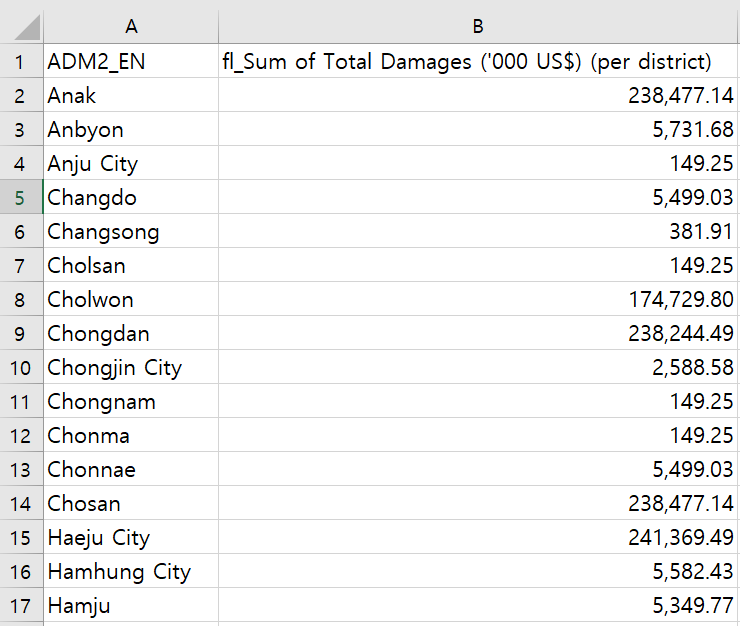
Now, what we need is an Excel or CSV file that includes all 179 administrative regions in the third column "ADM2_EN" and records flood damage estimates for each region.
The column in the attribute data to be combined with the spatial data's administrative region column must exactly match the wording of the spatial data's "ADM2_EN" column. Typos or unnecessary spaces should be avoided, so pre-screening is necessary.
Now, let's combine the two files.
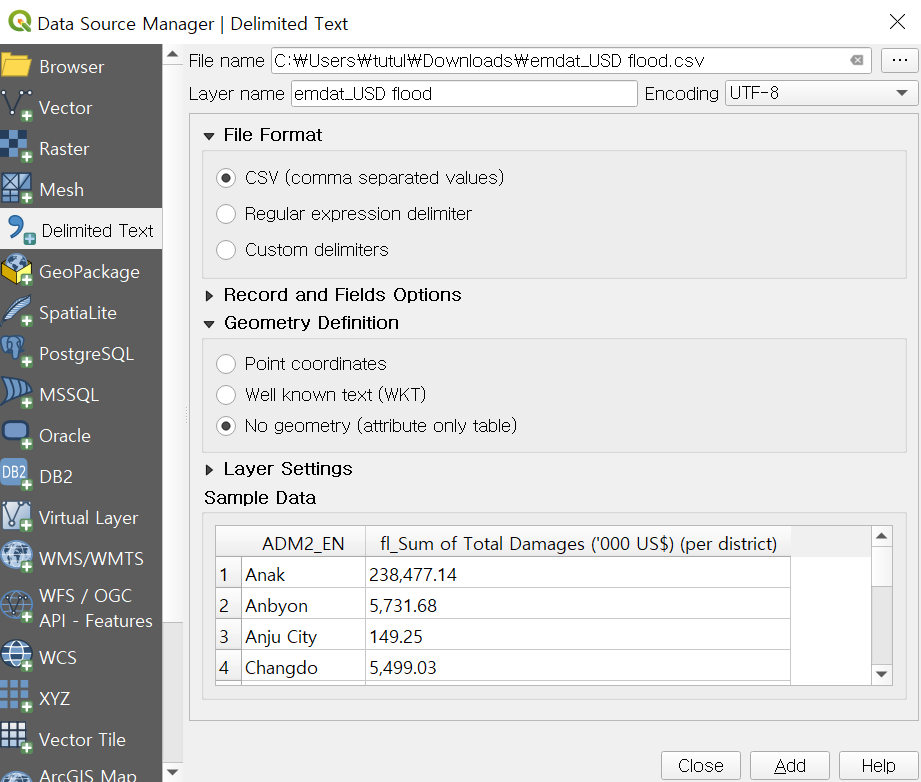
On the QGIS main screen, press Ctrl+L > Delimited Text > [...] > and load the saved CSV file.
- File Format: CSV
- Geometry Definition: No geometry (attribute only table)
Then click the 'Add' button.
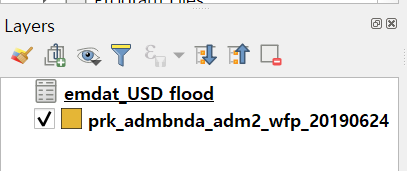
Only the CSV file will be added to the layer pane, and the screen will remain unchanged.
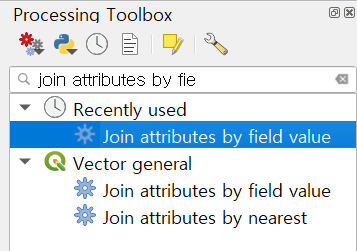
The tool needed to combine the two files is "Join attributes by field value."
Search for 'join attributes by field value' in the Processing Toolbox on the right or in the menu, then double-click it.
Select Input layer, Table field, Input layer 2, and Table field 2 as follows:
- Input layer = prk_admbnda_adm2 (spatial data)
- Table field = ADM2_EN (name of the column in the spatial data you want to join)
- Input layer 2 = emdat_USD flood (attribute data)
- Table field 2 = ADM2_EN (name of the column in the attribute data you want to join)
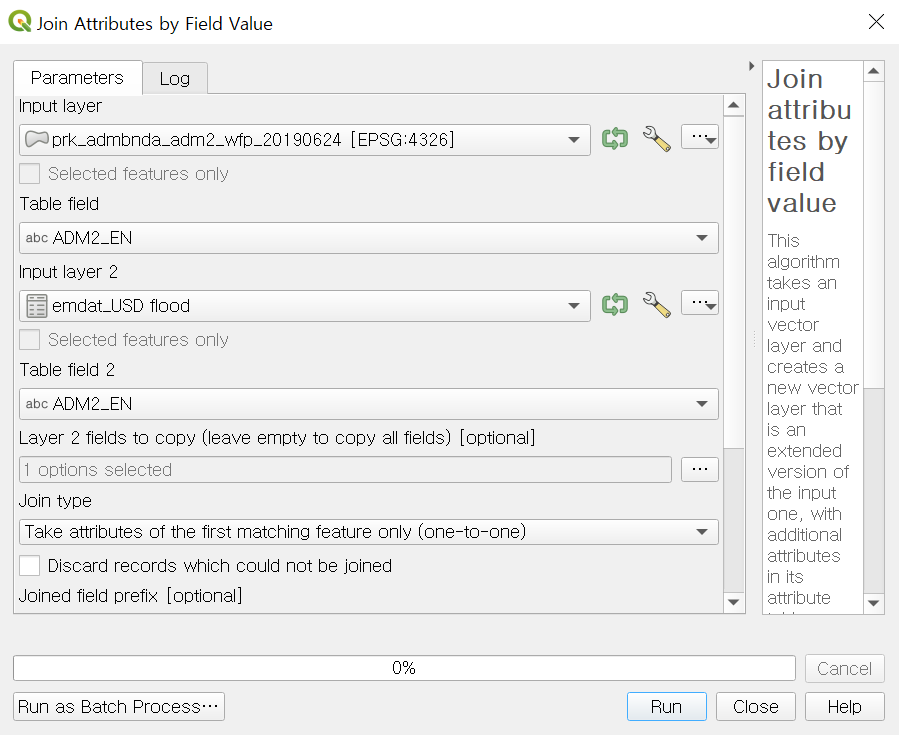
In the 'Layer 2 fields to copy' section, click [...] to select the new columns from the attribute data that you want to load after the merge, then click 'Run.'
Here, the "fl_Sum of Total Damages ('000 US$) (per district)" field is selected.

The 'joined layer' is added to the layer pane.

In the joined layer's attribute table, you can see that flood damage estimates from the CSV file have been combined on the rightmost column.

By adding attribute information to spatial data that didn't have any significant attribute information, you can create new visual data with legends and styles.

So, we've learned about the method of combining spatial data and attribute data, which is a core technique in GIS.
We'll come back with even more informative content next time.
Thank you.

'QGIS English Guidance > QGIS Intermediate' 카테고리의 다른 글
| [QGIS Intermediate] Editing the Attribute Table of a Vector Layer (0) | 2024.04.19 |
|---|

댓글